Taking Care of Brooklyn
Center for Brooklyn History,
2019
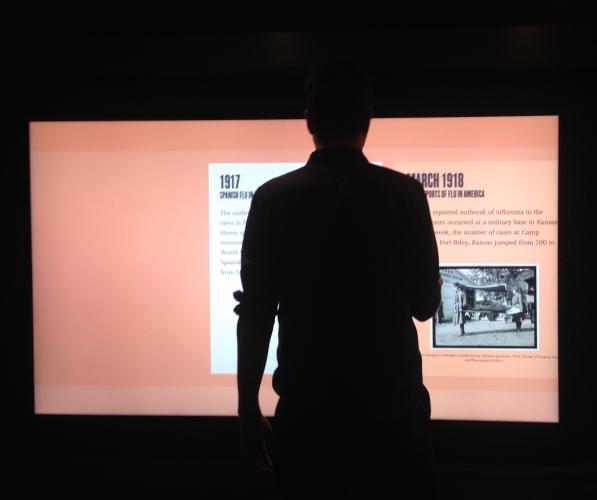
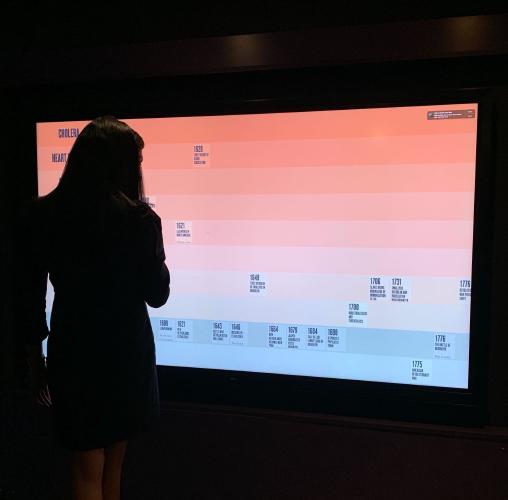
This museum installation at the Center for Brooklyn History features 9 interactive touch displays.

The exhibit includes a massive 86-inch touch screen with an interactive historical timeline.

It opened in June 2019, and was scheduled to run for 3 years.
Since then, the Brooklyn Historical Society was absorbed into the Brooklyn Public Library and renamed, and a global pandemic turned museums on their heads.
In the News
- Brooklyn Historical Society exhibit explores the meaning of sickness and health, The Washington Post,
Summary of the Taking Care of Brooklyn exhibit.
- Brooklyn’s history with public health on display at Historical Society exhibit, AM New York,
Details and photos of the Taking Care of Brooklyn exhibit.